
A few months ago Dane from JArchitect team was nice enough to offer me a free JArchitect 4 Pro license. Over the last days I finally managed to look into JArchitect.
JArchitect is a quite powerful static code analyser for JVM languages (besides Java it also supports Scala, Groovy and others). It is available for Windows, Linux and Mac OS X. In this post I want to show you some of JArchitect's features.
Getting started with JArchitect
As an example I analysed the popular Java Library JUnit using JArchitect. The Screenshots you in this post are all taken from the JUnit analysis result.
Importing JUnit into JArchitect was actually quite simple. Note that JArchitect analyses the compiled byte code, source files are not required. So I cloned the JUnit repository and called mvn compile. After that, all I had to do was adding JUnit's pom.xml to a new JArchitect project.
After pressing the Run Analysis button JArchitect summarizes common metrics on a dashboard screen:

Here we can see the lines of code, method complexity, comment rate and various other values. This summary is followed by a couple of trend charts that show how these values changed over time.
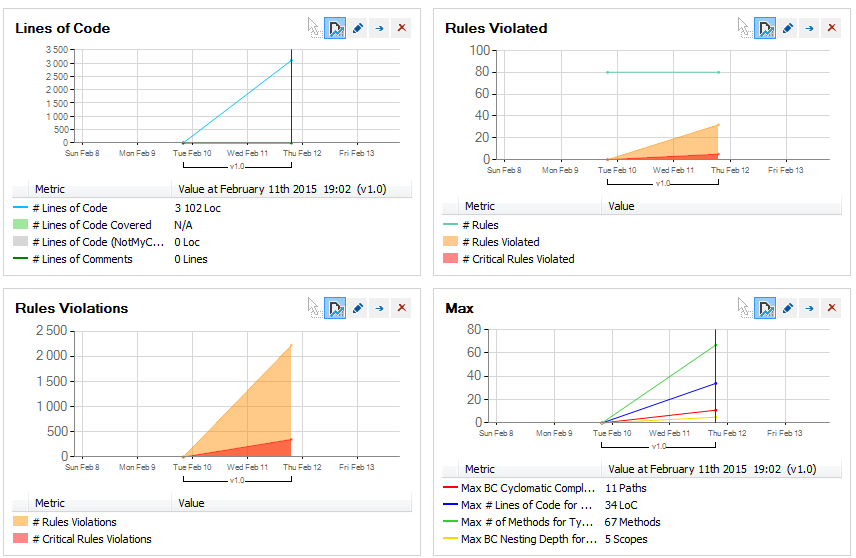
Of course you can also configure your own charts, if you want to see trends of different values.
Analyzing dependencies
Next we will look at the third party dependencies of JUnit. JArchitect provides a nice interactive graph for this.

Since JUnit only depends on the Java Runtime (rt) and Hamcrest this graph does not have much to show. I am sure you can imagine that this could be much more complex for a larger project.
Looking at JUnits package dependencies is a bit more interesting. The following Screen shows a section of JUnits package dependency graph.
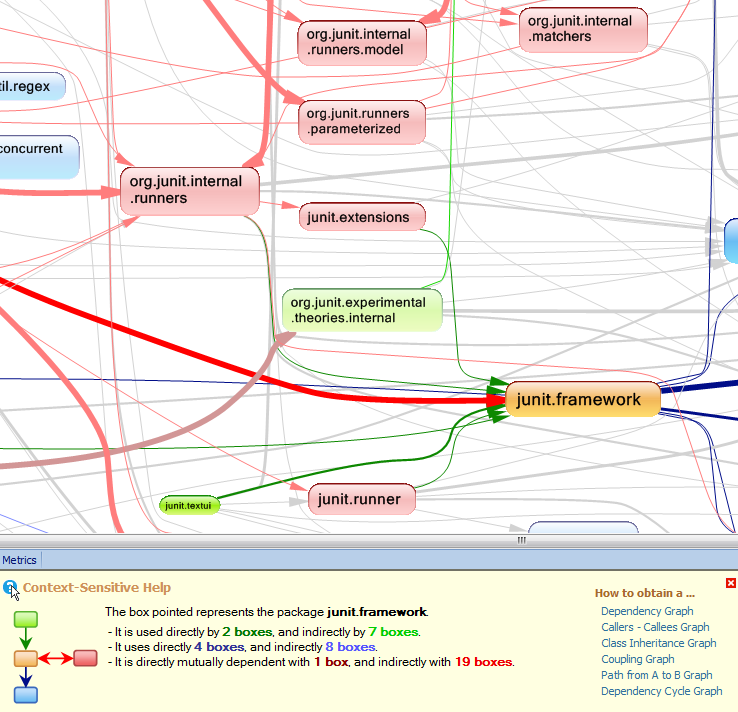
I selected the junit.framework package to see how this package relates to other packages. The different colored arrows show which packages use junit.framework (green), which other packages are used by junit.framework (blue) and mutually dependent packages (red).
The dependency matrix is another way to look at project dependencies:
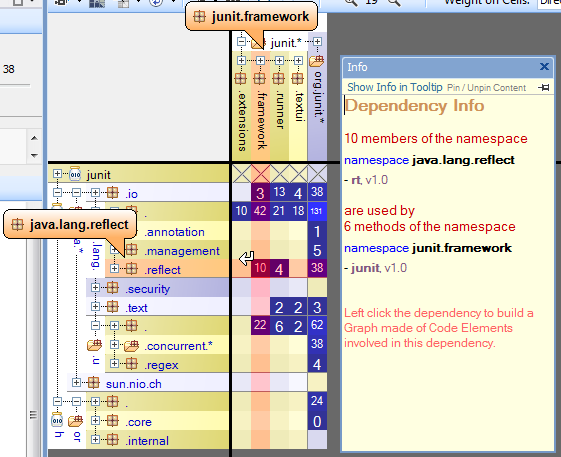
This matrix style view shows you exactly the dependencies between different components (packages, classes or methods). Here I selected the blue field with the number 10 (where the orange lines cross). This shows that the junit.framework package uses 10 members of the java.lang.reflect package (the dependency direction is shown by the white arrow at the selected field).
We can dig deeper, and look at this at class and method level.
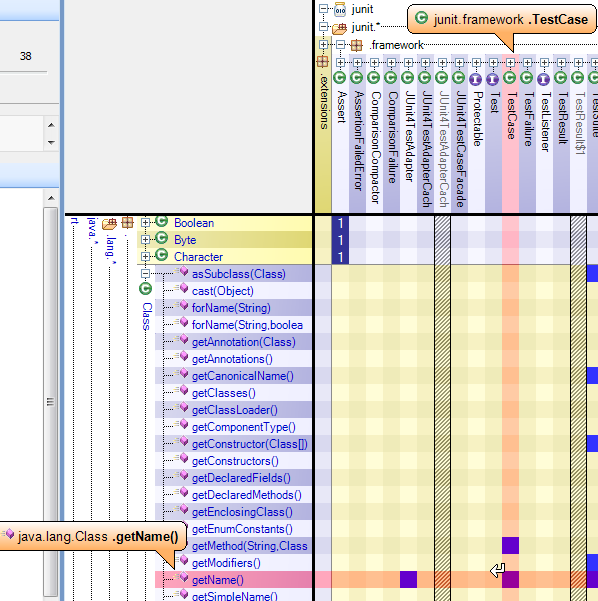
So it looks like the class junit.framework.TestCase makes use of the method java.lang.Class.getName().
Tree maps
Tree map charts are another way to look into a project with JArchitect. The following chart shows the number of code lines in JUnit packages, classes and methods.
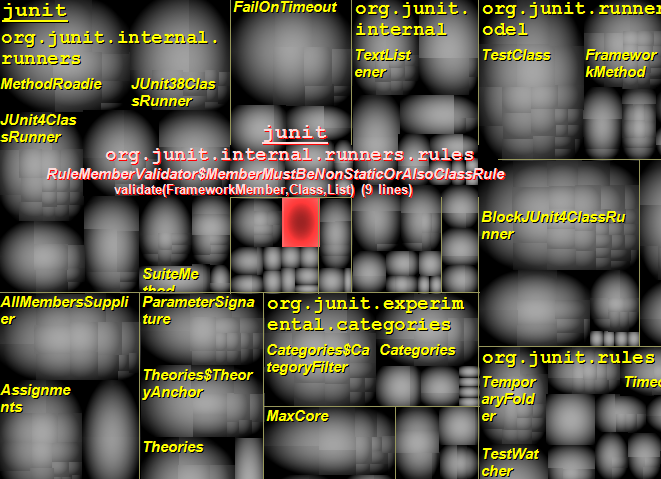
In this example chart we cannot see any overly large rectangle, which is a good sign. This probably means that complex parts are well divided into multiple classes and packages (no god object is present).
JArchitect can generate such tree maps for lines of code, cyclomatic complexity, number of variables and various other metrics.
Code queries
To extract various metrics out of a project, JArchitect uses a custom query language call Code Query Linq (CQLinq). As the name suggests this is a query language based on LINQ.
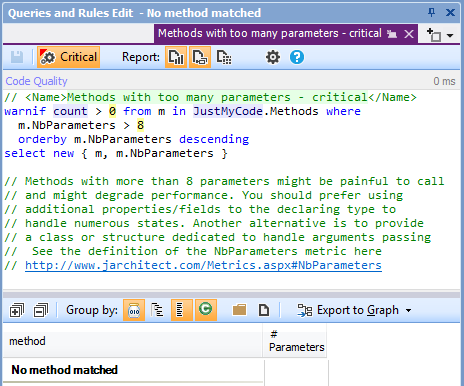
This image shows the query of JArchitect's Methods with too many parameters rule. It looks for methods with more than 8 parameters and creates a warning if one or more methods are found.
You can see (and change) all the standard queries provided by JArchitect. Code queries are actually a very cool feature. You can easily create your own queries to extract project specific data you are interested in.
Quick summary
JArchitect is a powerful tool for static code analysis. It can provide a lot of insight into complex code bases. Using custom code queries you are able to build your own rule sets in a very comfortable way.
In this example I used the JArchitect user interface (VisualJArchitect) for running the code analysis and viewing the results. It is also possible to integrate JArchitect directly into your build process (using a Maven plugin or command line tools). This way you are able to automatically create reports in HTML format.
Leave a reply